
Measuring OEE: formula, worked example and why it makes production more efficient
OEE (Overall Equipment Effectiveness) shows in a single number how much truly productive time a machine has in a shift. We explain the formula, walk through a realistic example and show how measurement turns into more good parts without buying a new machine.
"Our machines are well utilised" – we hear this in almost every factory. Once measurement starts, it often turns out that only 50–70% of the planned production time is actually spent making good parts. The difference is invisible to the naked eye: it disappears in micro-stops of a few minutes, slower cycles, drawn-out changeovers and scrap. OEE (Overall Equipment Effectiveness) makes this hidden loss visible.
What exactly does OEE measure?
OEE shows how much of the planned production time was truly productive: the time when the machine was running, at full speed, making good parts. It consists of three factors, each capturing one type of loss:
- Availability (A): how much of the planned time the machine was actually running. Losses: breakdowns, changeovers, material shortages, waiting.
- Performance (P): while running, how close it came to the ideal speed. Losses: micro-stops, slow cycles, reduced speed.
- Quality (Q): what share of the produced parts were good first time. Losses: scrap, rework, start-up rejects.
The OEE formula
OEE is the product of the three factors:
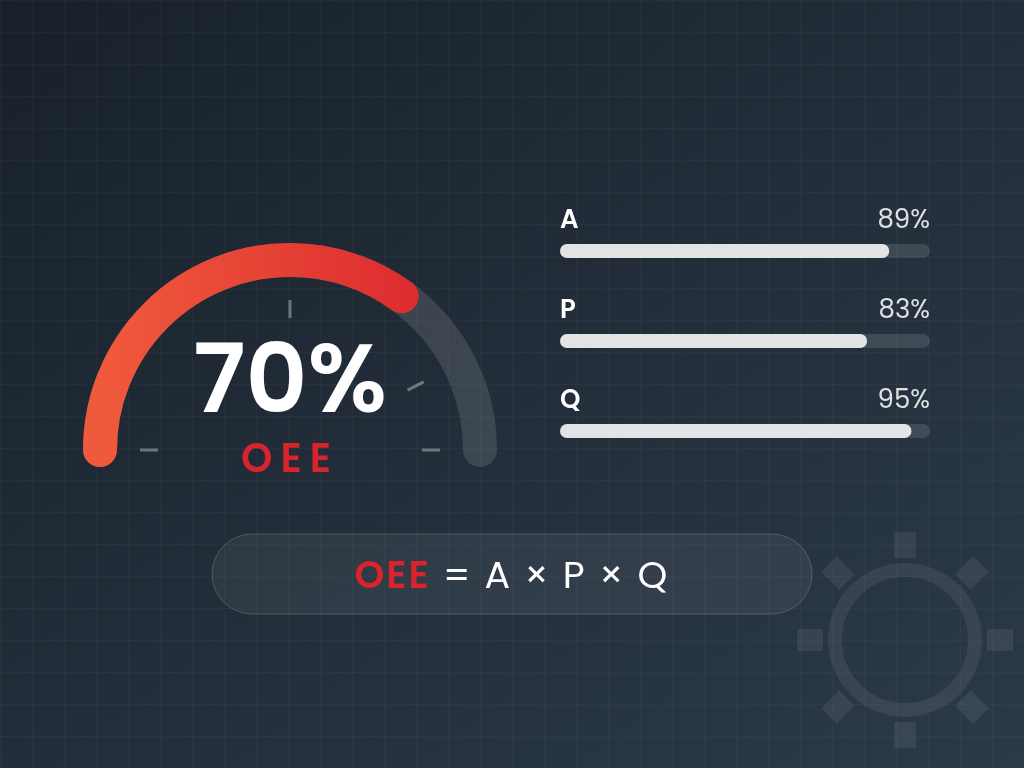
OEE = Availability × Performance × Quality
The individual factors:
A = Run timePlanned production time
P = Ideal cycle time × Total countRun time
Q = Good countTotal count
Definitions:
- Planned production time = shift time − planned stops (breaks, planned maintenance, no orders).
- Run time = planned production time − unplanned stops (breakdowns, changeovers, material shortages).
- Ideal cycle time: the shortest time in which the machine can theoretically produce one part (from the machine specification or the best measured value).
If you expand the formula, most terms cancel out and you get a very intuitive simplified form:
OEE = Good count × Ideal cycle timePlanned production time
This states exactly what OEE means: the minimum time needed to produce the good parts as a share of the production time actually available.
Worked example: one shift on an injection moulding machine
Take an 8-hour shift on an injection moulding machine with the following data:
| Data | Value |
|---|---|
| Shift length | 480 min |
| Planned breaks (2 × 15 min + 30 min lunch) | 60 min |
| Breakdown | 32 min |
| Mould change, changeover | 15 min |
| Ideal cycle time | 30 s / part (0.5 min) |
| Total count | 620 parts |
| Rejects | 31 parts |
1. Planned production time and run time
Planned production time = 480 − 60 = 420 min
Run time = 420 − (32 + 15) = 373 min
2. Availability
A = 373420 = 0.888 → 88.8%
3. Performance
In 373 minutes of run time the machine could ideally have produced 373 / 0.5 = 746 parts, but only 620 were made:
P = 0.5 min × 620 parts373 min = 310373 = 0.831 → 83.1%
4. Quality
Q = 620 − 31620 = 589620 = 0.950 → 95.0%
5. OEE
OEE = 0.888 × 0.831 × 0.950 = 0.701 → 70.1%
Check with the simplified formula:
OEE = 589 parts × 0.5 min420 min = 294.5420 = 70.1%
Where did the 420 minutes go? – losses in minutes
The real power of OEE shows when you convert the percentages back into time:
| Time category | Minutes | Share |
|---|---|---|
| Planned production time | 420 | 100% |
| − Availability loss (breakdown, changeover) | 47 | 11.2% |
| − Performance loss (micro-stops, slow cycles): 373 − 310 | 63 | 15.0% |
| − Quality loss (31 rejects × 0.5 min) | 15.5 | 3.7% |
| = Fully productive time | 294.5 | 70.1% |
The biggest loss is not the 32-minute breakdown everyone noticed, but the 63 minutes of performance loss: small hiccups and slower cycles that each seem insignificant. Manual paperwork almost never records them, so without measurement they stay hidden.
How to interpret the result
It varies by industry, but the following values are often used as reference levels in discrete manufacturing:
- 100%: perfect production – only good parts, at maximum speed, with no downtime. A theoretical limit.
- 85%: "world class" (A ≈ 90%, P ≈ 95%, Q ≈ 99.9%) – a long-term target for many factories.
- Around 60%: typical, with significant room for improvement.
- Around 40%: low, often seen in plants that have just started measuring.
At 70.1%, our example is above average, but it is clear where to start: performance (83.1%) is further from world class (95%) than the other two factors. Keep in mind that OEE is primarily meant to track the improvement of the same machine over time, not to rank different machines or plants.
The six big losses
The TPM (Total Productive Maintenance) methodology groups losses into six categories, each clearly belonging to one OEE factor:
| OEE factor | Loss | Typical example |
|---|---|---|
| Availability | Equipment failure | Broken tool, hydraulic fault |
| Setup and adjustment | Product change, warm-up, trial runs | |
| Performance | Idling and minor stops | Jammed part, sensor fault, waiting for material |
| Reduced speed | Worn tool, "safety" slowdown | |
| Quality | Process defects and rework | Dimensional deviation, surface defect |
| Reduced yield | First parts after start-up or changeover |
Why measuring and analysing OEE matters for a factory
- It reveals hidden capacity. Most factories have more capacity in their existing machines than they think – it just disappears as losses. OEE shows how much and where.
- Better investment decisions. Before buying a new machine, OEE lets you calculate whether the same extra output can be reached by using existing machines better – at a fraction of the cost.
- A common language for production, maintenance and management. A single metric everyone understands, which can be broken down into detailed losses.
- Fact-based priorities. A Pareto analysis of losses shows which 2–3 causes are responsible for most of the loss, so improvement effort goes where it pays off most.
- Identifying bottlenecks. A production line is only as fast as its weakest machine. A one-point OEE gain on the bottleneck raises the output of the whole line.
- More accurate planning and delivery reliability. When the real performance of the machines is known, production planning gives realistic deadlines, with fewer extra shifts and delays.
- The impact of improvements becomes measurable. The effect of a new maintenance routine or a faster changeover method is not a matter of opinion – it shows on the OEE trend.
How it makes production better and more efficient
Measurement alone does not improve anything – but it starts a cycle: measure → find the causes of losses → take targeted action → measure the effect. Typical actions depend on the loss uncovered:
- Changeover losses: SMED (single-minute exchange of die), preparation while the machine is still running, standardised setup parameters.
- Breakdowns: preventive and predictive maintenance, root cause analysis, autonomous maintenance by operators.
- Micro-stops and slow cycles: eliminating the most frequent jam causes, improving material supply, monitoring tool wear.
- Scrap: monitoring process parameters and alerting early when a value starts to drift – before scrap is produced.
What is it worth? Let's continue with our example. If the machine's OEE improves from 70.1% to 80%, the number of good parts per shift becomes:
Good count = OEE × Planned production timeIdeal cycle time = 0.80 × 4200.5 = 672 parts
- +83 good parts per shift (672 instead of 589), i.e. +14.1% output.
- With three shifts and 250 working days a year: 83 × 3 × 250 = 62,250 extra parts per year.
- In time: 83 × 0.5 min = 41.5 min per shift, about 519 hours a year – roughly 65 full shifts of extra capacity.
All of this without a new machine, new staff or more energy: the same machines, the same people, the same number of shifts – just fewer losses. Because fixed costs (machine depreciation, wages, building) are spread over more good parts, the cost per part goes down, and less scrap means less wasted material and energy.
Common mistakes in measuring OEE
- An ideal cycle time that is too generous: if the "usual" cycle time is taken as ideal instead of the real one, performance looks artificially high and the loss disappears.
- Classifying losses as "planned stops": if changeovers or material shortages are recorded as planned downtime, the number looks better, but the improvement opportunity stays hidden.
- Manual data entry: data recorded on paper at the end of the shift almost always misses short stops, and operators write down the reasons from memory.
- Averaging percentages: the OEE of several machines or shifts must not simply be averaged. Add up the times and counts, then recalculate from those.
- Using OEE to blame people: if the metric is used to penalise workers, the numbers start to "improve" on paper. OEE is for improving the process, not for evaluating people.
Note: if you also want to examine how well calendar time is used, not just planned production time (for example, whether a third shift could be added), TEEP (Total Effective Equipment Performance) is the right metric: TEEP = OEE × utilisation (planned production time / total calendar time).
From manual data collection to automatic OEE
OEE becomes a truly useful tool when the data arrives automatically and in real time. A modern Industry 4.0 solution is typically built like this:
- Machine data collection: machine status, cycle signals and part counters come straight from the PLC (OPC UA, Modbus, Siemens S7) or via MQTT. Older machines can be retrofitted with simple sensors and IoT modules.
- Recording downtime reasons: on a tablet next to the machine, the operator selects the reason for a stop with a single tap – the system measures the time, not someone's memory.
- Real-time dashboard: OEE and its three factors per machine, shift and product, with losses on a Pareto chart.
- Alerts: if a machine is down for longer than allowed or the cycle time drifts, the person responsible is notified immediately.
- AI-based analytics: anomaly detection and predictive maintenance can run on the collected time-series data and flag likely failures in advance.
- Integration: production data flows into the ERP / MES, so production planning and cost accounting work with real numbers.
Summary
Behind a simple formula, OEE is a very powerful management tool: it shows the true effectiveness of the machines in a single number, and broken down into its three factors, it shows where the valuable minutes are lost. In our example nearly 30% of the planned time was lost, and the largest part of it was exactly what nobody saw. With regular – ideally automatic – measurement and analysis, improvements go where they have the biggest impact, so the same machines produce more good parts at a lower cost per part.
If you would like to know how much hidden capacity your machines have, we can help you set up automatic data collection and an OEE dashboard – starting with a pilot project on just a few machines.